Aggregate Queries: The Ulitmate Power Up
This is it. I saved the best for last. Aggregate queries will supercharge your SOQL skills and make you — dare I say — The. Best. Admin. Ever. That may sound like hyperbole, but follow along and see for yourself.
(If you’re new to SOQL and missed the first two parts of the series, jump on over to Part 1 before moving any further!)
What Can Aggregate Queries do for Admins?
In short, whereas a standard SOQL query allows you to create a quick, on-the-fly tabular report in the dev console (ie, a filtered list of records), an aggregate query gives you the ability to create a summary report, where you group results by one or more fields.
So, why do we care?
First, this is faster and easier than creating a report in Salesforce. This allows you to see the data quickly, and then decide if you want to go through the trouble of replicating it in Report Builder. And second, like a summary report, it enables you to slice and dice your data in ways that can reveal trends — ones you can tweak to improve processes and productivity.
Blah, blah, blah… am I right? Well, as they say, a screenshot is worth a thousand blahs:
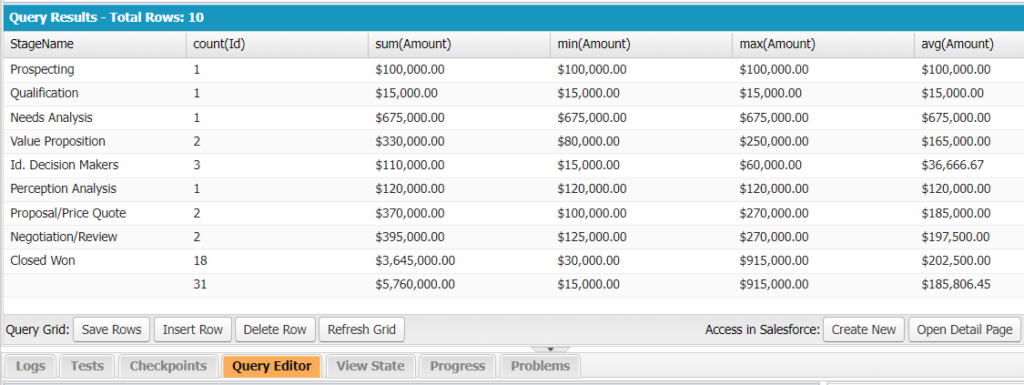
The above table was returned using a single aggregate SOQL query on the Opportunity object. For a query that was formulated in under a minute, it sure tells us a lot about our sales pipeline. So, follow along to see how running a quick aggregate query can be a powerful tool in your Admin toolkit.

SOQL Aggregate Functions
To start, I need to introduce you to SOQL aggregate functions. They are COUNT(), SUM(), MIN(), MAX() and AVG(). Do they look familiar? They should if you’ve ever dealt with roll-up summary fields. And if not, their names are self-explanatory.
COUNT()
COUNT() does what you would expect — it counts the records. If you haven’t already noticed, the dev console already displays the number of records it returns when you run a standard SOQL query. But let’s say you wanted the query to only return the count, not the records themselves. The query might look something like this:
SELECT COUNT()
FROM Account
Copy and paste the above SOQL query into the console and you’ll get something similar to this screenshot:
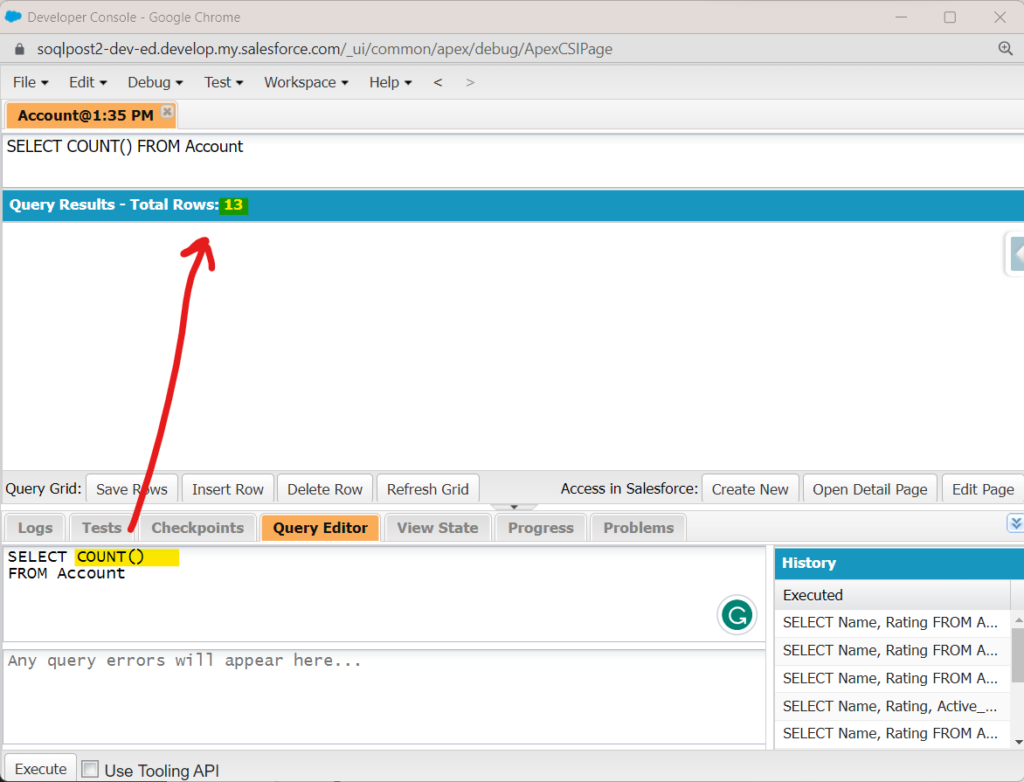
Above, we can see that 13 rows (records) were found. This means there are 13 Account records in this Salesforce dev org.
Now, there’s COUNT() and there’s COUNT(fieldName). COUNT() was the first aggregate function made available by Salesforce and, as you can see in the example, it doesn’t take a field name inside its parentheses. It was originally designed to count records when a filter was added. For instance, if we wanted to know how many accounts were based in California:
SELECT COUNT()
FROM Account
WHERE BillingState = 'CA'
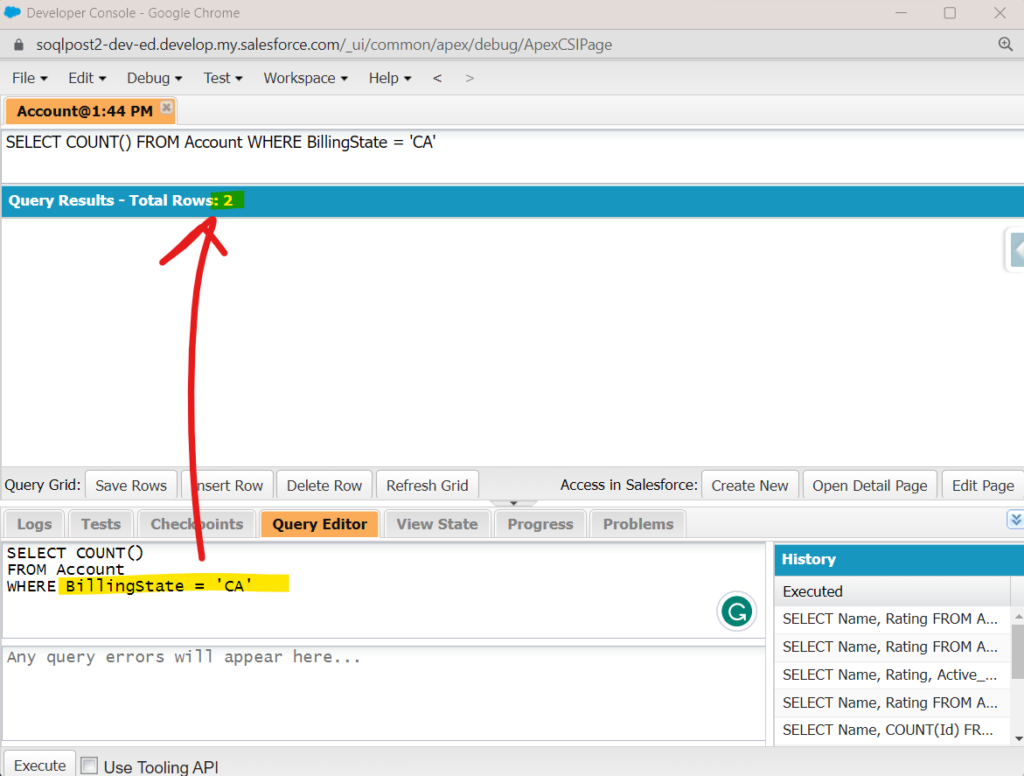
Based on the number returned, we can see that there are 2 accounts located in California in this dev org.
While COUNT() is useful, it’s often not used due to its inherent limitations. For example, COUNT() must be the only element in the SELECT clause and it can’t be used with an ORDER BY or GROUP BY clause (covered below).
For this reason, it’s best to use COUNT(fieldName) instead. And the most common field used is Id — COUNT(Id). This is because every record has an ID and it’s always unique (there are never duplicates). Here’s an example:
SELECT COUNT(Id)
FROM Account
WHERE Name LIKE 'E%'
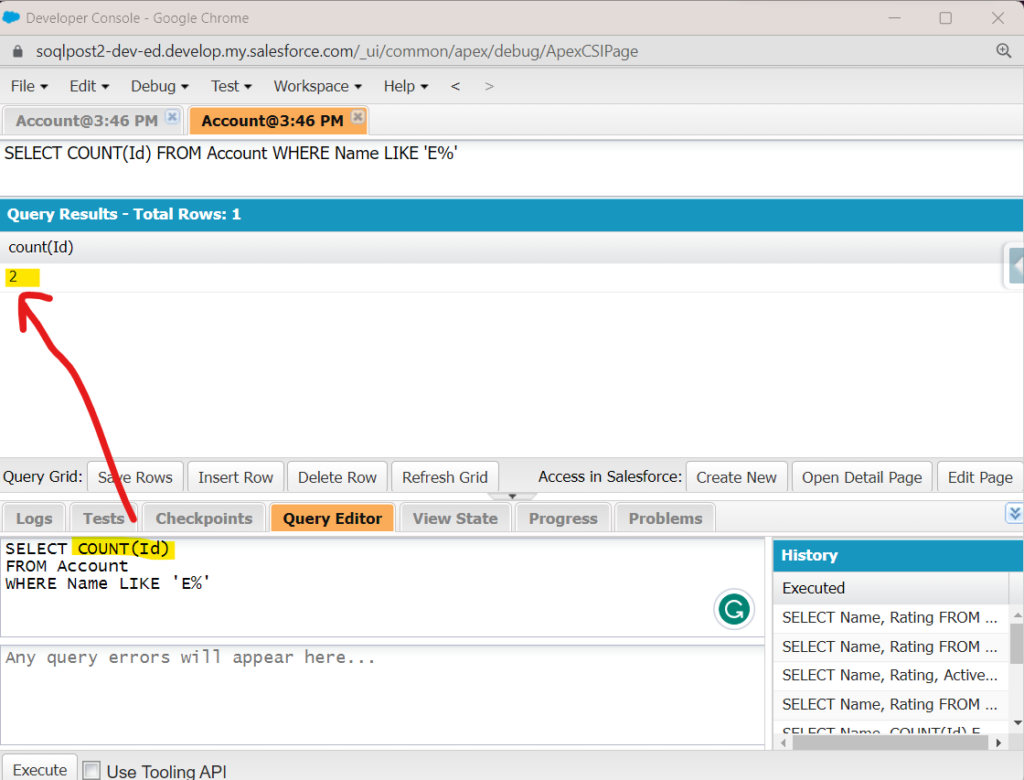
Can you see what it’s counting? That’s right, all accounts that start with the letter ‘E’. (And if you didn’t know that, be sure to go back to Part 2 to learn about the LIKE keyword.)
Also, notice a couple of differences between COUNT(fieldName) and COUNT(). First, as already pointed out, you need to wrap the field name in parentheses. Also, notice that the number returned is in a different place in the results pane than when we used COUNT(). Why is that? While it’s not exactly important to know as an admin (unlike a developer), COUNT() returns an integer whereas COUNT(fieldName) returns an AggregateResult (an object I’ll mention again later).
And just in case you thought we were done with COUNT functions, later I’ll introduce you to a kissing cousin of COUNT() called COUNT_DISTINCT().
Finally, it’s important to point out that the rest of the functions covered below will include a field name wrapped inside each function’s parentheses.
On Your Own: You’re asked to provide the number of new contacts added to Salesforce this fiscal quarter. How would you write that query? Tip: Consider filtering on a system field using a date literal. Need a refresher on dates and date literals? Review Part 1 of the series.
SUM()
Moving along, we have SUM(), a function that will total the values of a number or currency field (eg, Amount on Opportunity). For example, let’s say we want to know the total amount of all ‘Closed Won’ opportunities for our org. We can write the following aggregate SOQL query:
SELECT SUM(Amount)
FROM Opportunity
WHERE StageName = 'Closed Won'
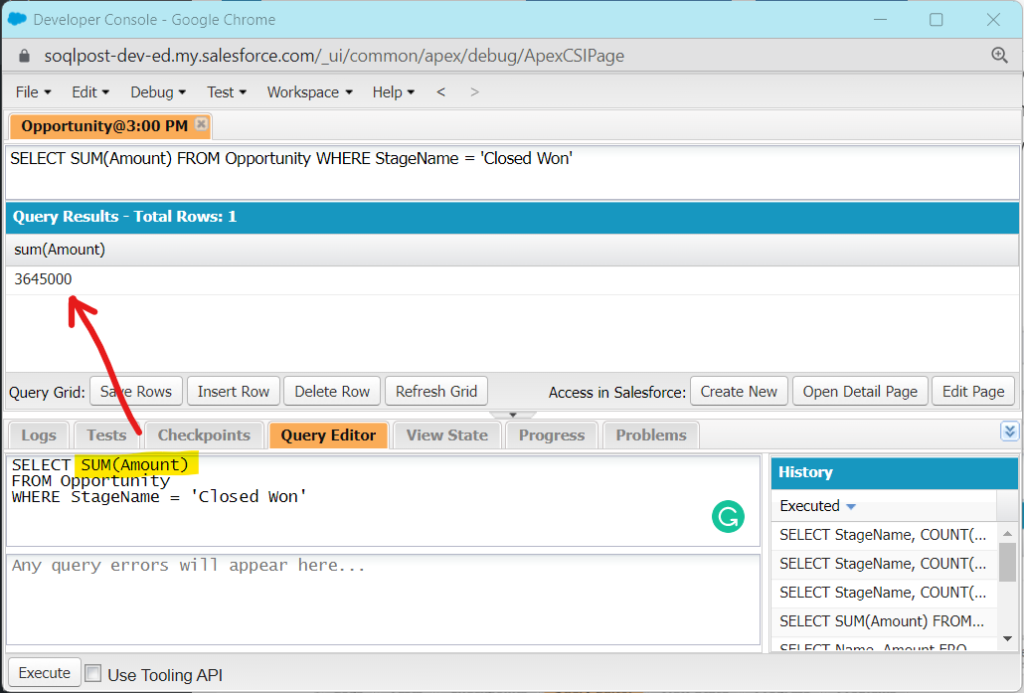
From the screenshot, we can see that $3,645,000 was returned. But you may have noticed it’s not formatted, so just like we learned in Part 1, you can use the FORMAT() function to make currency fields easier to read. You’ll see an example below.
Own Your Own: Sales has asked for the total amount of all open opportunities that are scheduled to close this month. How would you write that query? Tip: Consider using a NOT IN clause when filtering the opportunity stage name. Be sure the result is formatted.
MIN() & MAX()
Now let’s say we want to know the lowest and highest ‘Closed Won’ opportunity amounts in our org. We simply use the MIN() and MAX() functions, adding the same Amount field inside the parentheses.
And to better help us read the currency fields, we can use FORMAT() to add the dollar sign and delimiters back in. Finally, because it seems useful, let’s also add a record count:
SELECT COUNT(Id), FORMAT(SUM(Amount)), FORMAT(MIN(Amount)), FORMAT(MAX(Amount))
FROM Opportunity
WHERE StageName = 'Closed Won'
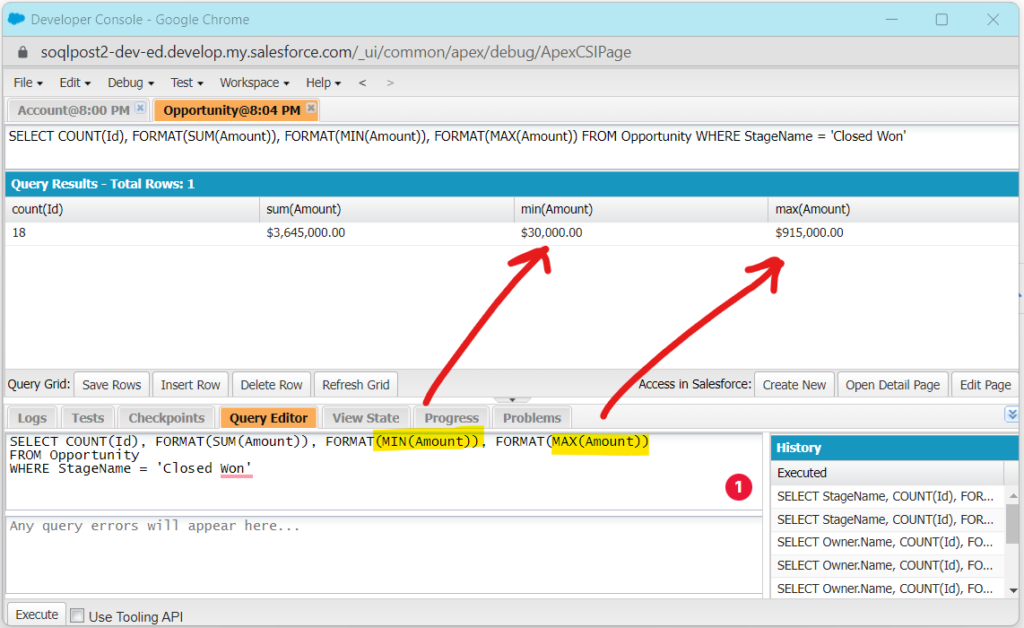
Based on the results above, we have 18 ‘Closed Won’ opportunities totaling $3,645,000. Of those, the lowest amount (min) is $30,000 and the highest (max) is $915,000. Also, notice how the FORMAT() function wraps around the entire aggregate function.
And did you know you can use MIN and MAX on dates? It’s true. MIN will pull the oldest date, whereas MAX will pull the most recent date.
On Your Own: You’re asked to find the overall lowest and highest opportunity amounts among all the ‘United Oil’ accounts. Can you write a single query to find those numbers? It should only return one row of data. Tip: Use the LIKE operator and % wildcard when filtering account names.
AVG()
Finally, we can use AVG() to return the average of any number or currency field (eg, Amount).
SELECT COUNT(Id), FORMAT(SUM(Amount)), FORMAT(MIN(Amount)), FORMAT(MAX(Amount)), FORMAT(AVG(Amount))
FROM Opportunity
WHERE StageName = 'Closed Won'
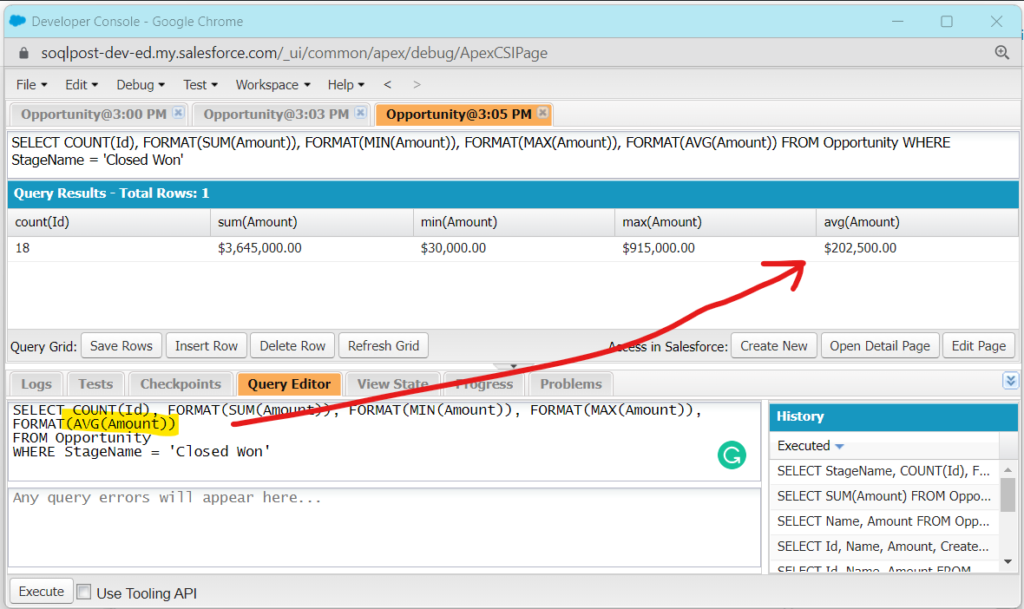
By now, you should begin to see how powerful aggregate queries can be. They allow us to quickly view key metrics in our organization.
(Some of you may have also noticed that Salesforce kindly gives us AVG() for aggregate queries, but doesn’t for roll-up summary fields. Thanks, Salesforce!)
On Your Own: You’re asked to find the average opportunity amount of all ‘Closed Won’ Opportunities for accounts located in California, Illinois, and Texas (combined, not individually). Be sure the result is formatted correctly. Tip: You will need to filter on a parent record field.
Where Are the Records?
If you have experience building reports in Salesforce you’ve likely created summary reports. These are created by grouping one or more fields and contain sub and grand totals. We can do something similar with an aggregate query, but (and this is the important part!) instead of returning rows of records, we get rows of numbers. Specifically, we get an sObject called AggregateResult.
While that sounds like a mouthful, we’ve already been dealing with this object in nearly all of our examples above. Simply put, an AggregateResult is an object that holds a row of data created by using one or more aggregate functions in a query.
For anyone new to aggregate SOQL queries, this can be confusing. We’re used to seeing records returned when we run a SOQL query, but that’s not going to happen when we use aggregate functions. Instead, we get one or more rows of aggregate (function) results.
SOQL Error: Name Must be Grouped or Aggregated
Because you’re still learning how to write SOQL queries, it’s only a matter of time before you receive the following SOQL parsing error: Field must be grouped or aggregated. This message is then followed by the offending field name. But what does it mean? As it states, you either didn’t include the indicated field in a GROUP BY clause (covered below) or you forgot to wrap it in an aggregate function (eg, COUNT or SUM).
But what it really means is that you were likely trying to extract additional data (eg, Name, CreatedDate, CloseDate, etc.) in a manner that isn’t compatible with the aggregate SOQL query type. Remember, we cannot access individual records when using aggregate functions.
If that doesn’t make sense, don’t worry — it will with time. Read on.
Power up Your Aggregate Queries: GROUP BY
While you may not see the value right now in running a SOQL query that doesn’t return individual records, you’ll soon learn to appreciate the data you can pull by using aggregate functions. However, to really harness their power, we need to use the aggregate GROUP BY clause. This allows us to repeat the query for a specific field for each of its active values.
Huh?
As always, it’s easier to show an example than try to explain. To do that, we’ll add a GROUP BY clause to our current query. But instead of seeing results for only ‘Closed Won’ opportunities, adding GROUP BY StageName will show us results for all active stages. GROUP BY clauses are perfect for picklist fields — especially those that have a limited number of values (eg, 10 or less).
SELECT StageName, COUNT(Id), FORMAT(SUM(Amount)), FORMAT(MIN(Amount)), FORMAT(MAX(Amount)), FORMAT(AVG(Amount))
FROM Opportunity
GROUP BY StageName
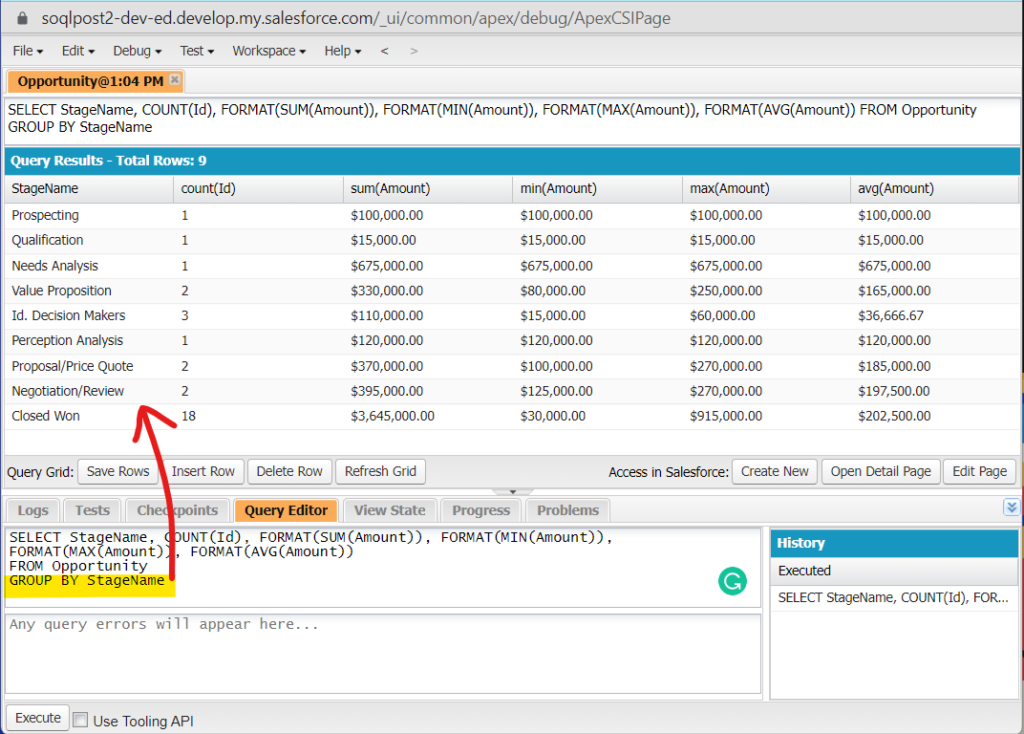
Notice that we now have 9 rows of data — one for each active StageName. By active, I mean any StageName value that is being used in at least one record. For example, notice there is no row that represents the ‘Closed Lost’ stage. That’s because no opportunity record is currently listed as ‘Closed Lost’ under StageName in our out-of-the-box Salesforce dev org.
It’s important to note a few more observations about the query and the results above:
First, I added StageName to the SELECT clause. If I hadn’t, we wouldn’t know which stage was associated with each row. Also, notice how this is the only field name not wrapped in an aggregate function. We can add it here only because it’s also used in our GROUP BY clause. In addition, see how the stage names are listed in the order they normally appear in the picklist arrangement.
Second, I removed the WHERE clause. Although we can combine a WHERE clause with a GROUP BY clause, we didn’t need to in this case since we don’t need to filter the results.
Third, notice that the count in the query header is 9. This is the number of rows returned, not the total record count from the count column (which totals 31).
Roll ‘Em Up! GROUP BY ROLLUP
Speaking of totals, it sure would be nice to see a rollup of all of our columns. One that would give us the overall count and sum, as well as the min, max, and avg based on all rows. Is that even possible? You bet!
To do so, you need to replace your GROUP BY clause with a GROUP BY ROLLUP clause. You then wrap the grouped field(s) as shown below:
SELECT StageName, COUNT(Id), FORMAT(SUM(Amount)), FORMAT(MIN(Amount)), FORMAT(MAX(Amount)), FORMAT(AVG(Amount))
FROM Opportunity
GROUP BY ROLLUP (StageName)
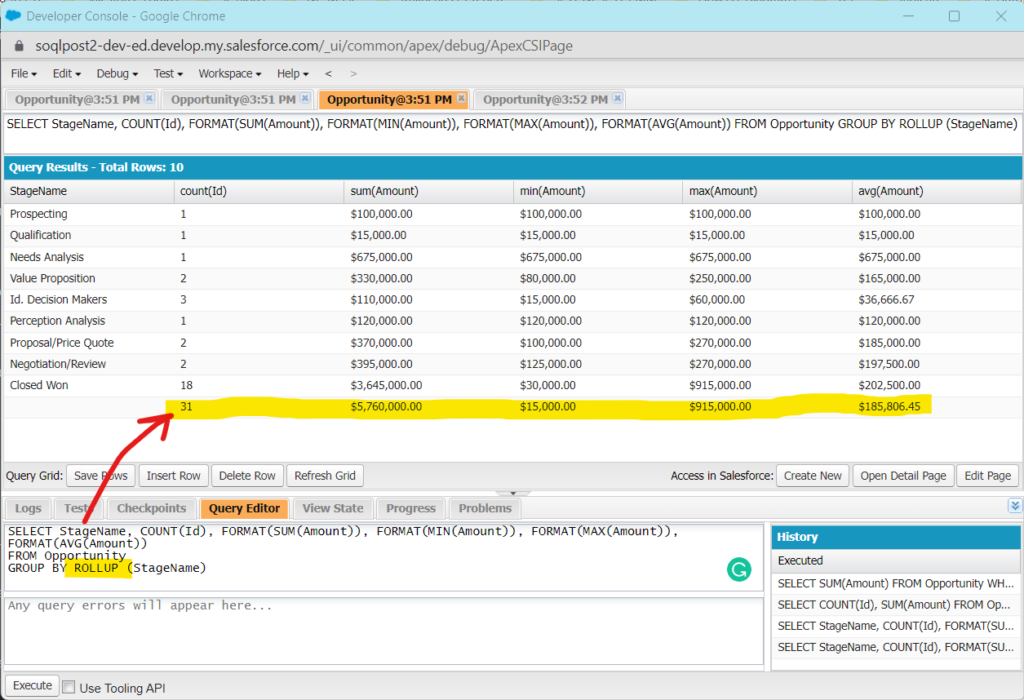
Now, instead of crunching the numbers ourselves, the rollup does the work for us. Nice!
ORDER BY vs GROUP BY
It’s worth stopping for a moment here to discuss ORDER BY vs GROUP BY. When I first learned SOQL, I would often mistakenly use the GROUP BY clause when I meant to use ORDER BY. I would do this when I was writing a standard SOQL query (not an aggregate query). The error message returned is the same as discussed above.
As a refresher, ORDER BY is used to indicate which column(s) you want the data ordered by (eg, alphabetically by account name). GROUP BY is used to indicate how the aggregate data should be grouped (eg, by opportunity stage name).
This is all to say, if you get an error when executing a standard SOQL query, be sure to check that you’re not substituting the GROUP BY clause for ORDER BY. (And yes, you can combine the two in an aggregate query.)
Filtering Queries: WHERE
As we saw in Part 2, it makes sense to filter your query so that it only returns the subset of data you want. And as you already learned, one of the ways to do this is by using a WHERE clause. In fact, we’ve already used it above when we filtered by the ‘Closed Won’ stage.
And we can do the same thing here. Let’s say we wanted to use our GROUP BY or GROUP BY ROLLUP clause, but limit the values returned on that grouped field. For instance, we could filter our StageName to only return the ‘Prospecting’, ‘Negotiation/Review’, and ‘Closed Won’ stages. Here’s what that would look like:
SELECT StageName, COUNT(Id), FORMAT(SUM(Amount)), FORMAT(MIN(Amount)), FORMAT(MAX(Amount)), FORMAT(AVG(Amount))
FROM Opportunity
WHERE StageName IN ('Prospecting', 'Negotiation/Review', 'Closed Won')
GROUP BY ROLLUP (StageName)
Copy and paste the query into the dev console and hit ‘Execute’. You should get something like the screenshot below. (And if you need a refresher on the IN clause, see Part 2.)
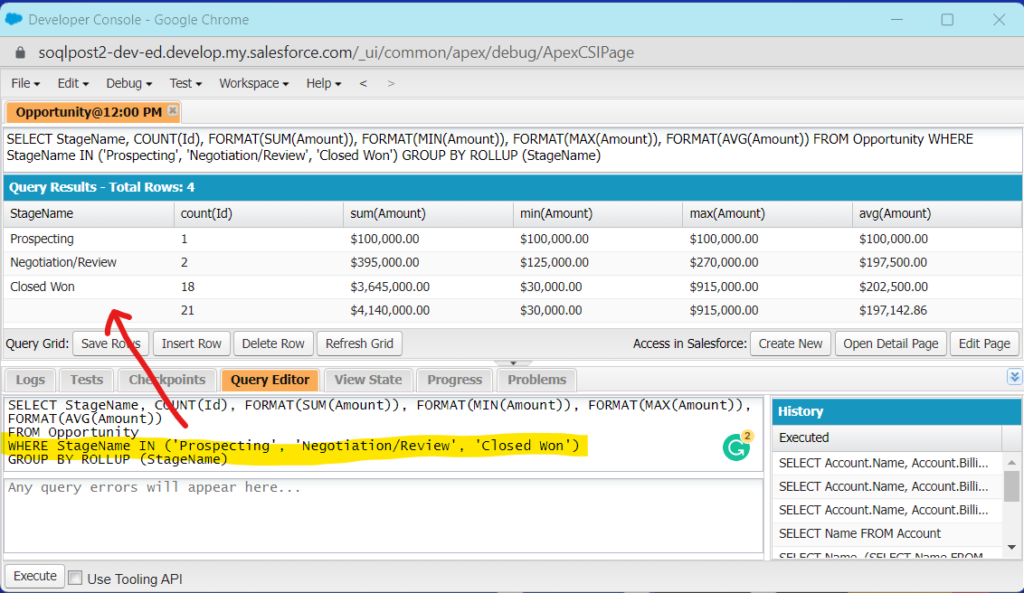
After running the query, we can see that only those three stages were used and displayed in the query. Likewise, the roll-up summary field at the bottom only reflects data from those three stages.
Filtering Queries: HAVING
But what if we wanted to filter the query by one of the aggregate functions instead? Let’s say we only wanted to see stages where the SUM totaled more than $100,000. For that, we would need to use the HAVING clause.
Here’s how we would update that query (after removing the recently added WHERE clause):
SELECT StageName, COUNT(Id), FORMAT(SUM(Amount)), FORMAT(MIN(Amount)), FORMAT(MAX(Amount)), FORMAT(AVG(Amount))
FROM Opportunity
GROUP BY ROLLUP (StageName)
HAVING SUM(Amount) > 100000
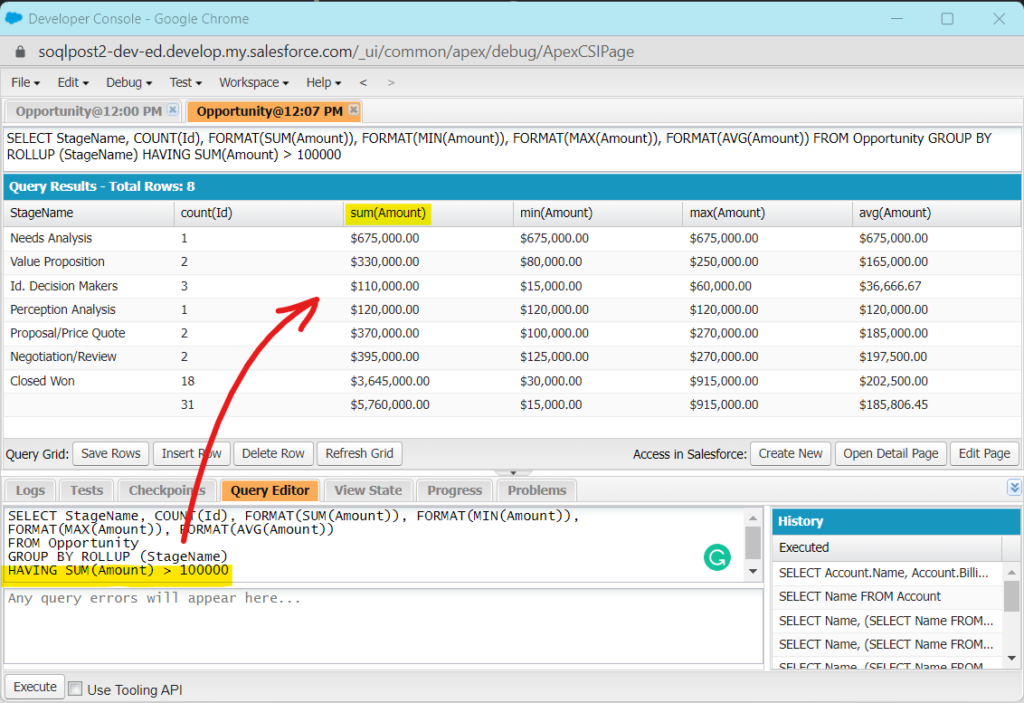
Now, as the screenshot above shows, only stages where the stage SUM is greater than $100,000 are shown. As a result, we lost two stages: ‘Prospecting’ ($100,000) and ‘Qualification’ ($15,000).
What’s important to remember is that a HAVING clause can only be included in aggregate queries. And like the WHERE clause, you can actually use a HAVING clause on a field that’s not in the SELECT clause as long as it’s wrapped in an aggregate function.
Notice also that the HAVING clause goes after the GROUP BY (or GROUP BY ROLLUP) clause.
Achtung Baby! Deceiving Rollups With a Having Clause
Warning: your roll-up numbers may deceive you whenever you combine a HAVING clause with a GROUP BY ROLLUP clause. To see what I mean, look at the last screenshot above. Now, count up the records individually in the COUNT column. Did you come up with 29 even though the total shows 31? Why is that?
The HAVING clause only filters what you see, not what’s rolled up. In other words, the HAVING clause does not remove the records that are used to calculate the roll-up summary row. This is true for all of the columns in the roll-up summary field, not just for the COUNT column.
What does this mean for you? To avoid confusion (and bad data), avoid using a HAVING clause with a GROUP BY ROLLUP clause. Only use it with a GROUP BY clause.
But if you need a roll-up summary row in cases like this, then use a WHERE clause and an appropriate non-aggregated field to filter the data if possible. For example, here’s how we could write the previous query to get the roll-up summary row to reflect the right numbers:
SELECT StageName, COUNT(Id), FORMAT(SUM(Amount)), FORMAT(MIN(Amount)), FORMAT(MAX(Amount)), FORMAT(AVG(Amount))
FROM Opportunity
WHERE StageName NOT IN ('Prospecting', 'Qualification')
GROUP BY ROLLUP (StageName)
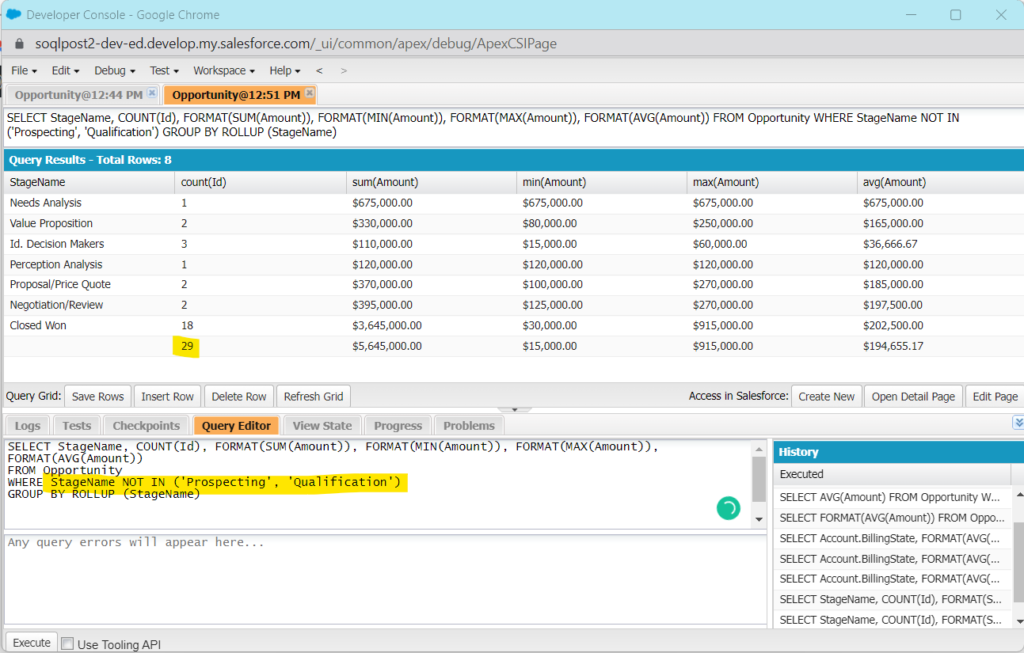
Here, we’ve removed the ‘Prospecting’ and ‘Qualification’ stages since their individual sums did not exceed $100,000. Of course, this query is no longer dynamic like the one with the HAVING clause, so it doesn’t serve as a long-term solution. However, for our purposes right now, the total COUNT now shows 29 instead of 31, even though the StageName rows are the same as before.
Using More than One GROUP BY Field
Returning to our previous query, what if we also wanted to see the fiscal quarter listed in the results? It’s a reasonable request, but how do you do it? This would require (1) a Salesforce date function, and (2) adding an additional field to the GROUP BY ROLLUP clause.
Since there’s no fiscal quarter field on the opportunity object, we need to wrap the CloseDate in the Salesforce date function to extract the fiscal quarter (more on that below). We’ll also remove the HAVING clause.
Here’s the new query (look over it carefully):
SELECT FISCAL_QUARTER(CloseDate), StageName, COUNT(Id), FORMAT(SUM(Amount)), FORMAT(MIN(Amount)), FORMAT(MAX(Amount)), FORMAT(AVG(Amount))
FROM Opportunity
GROUP BY ROLLUP (FISCAL_QUARTER(CloseDate), StageName)
As you can see above, the date function being used is FISCAL_QUARTER (). You can use it with any date field to extract the fiscal quarter (1-4) based on the fiscal year parameters in company settings. Also, notice that I added it to the SELECT clause as well (in addition to the GROUP BY ROLLUP clause). This ensures that we will be able to see the quarter for each row. Here are our results after running the query:
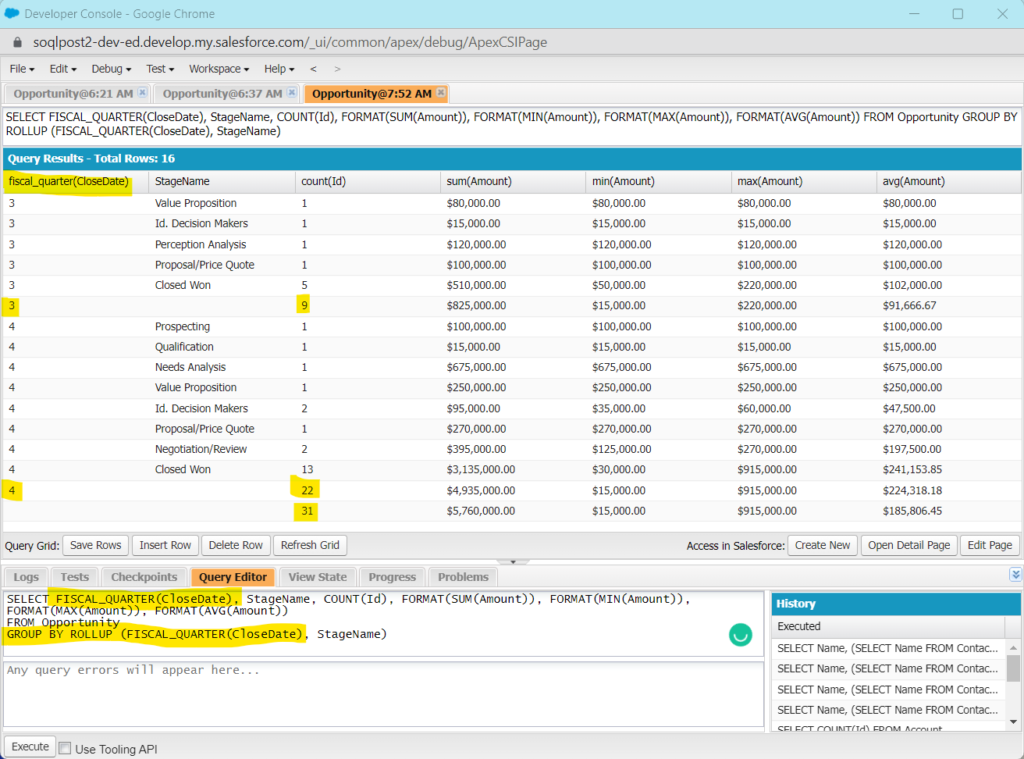
The first thing you should notice is that the rows are broken down by fiscal quarter. The second thing I want you to notice is that each fiscal quarter has its own roll-up (summary) row. This is in addition to the overall rollup field at the very bottom (where the fiscal quarter is blank).
For those of you who have really picked over the screenshot, you might be wondering how to break it down by year. Right now the data is sorted by fiscal quarter regardless of year. And for some, that could be very helpful. But if you have data in your org that expands multiple years (which we don’t have in this dev org), breaking the data by year (in addition to quarter) may be helpful as well (especially if you want to see year-over-year growth). But how do we do that?
Lucky for us, we can include up to 3 fields in a GROUP BY (or GROUP BY ROLLUP) clause. So, let’s also break it down by fiscal year as well like this:
SELECT FISCAL_YEAR(CloseDate), FISCAL_QUARTER(CloseDate), StageName, COUNT(Id), FORMAT(SUM(Amount)), FORMAT(MIN(Amount)), FORMAT(MAX(Amount)), FORMAT(AVG(Amount))
FROM Opportunity
GROUP BY ROLLUP (FISCAL_YEAR(CloseDate), FISCAL_QUARTER(CloseDate),StageName)
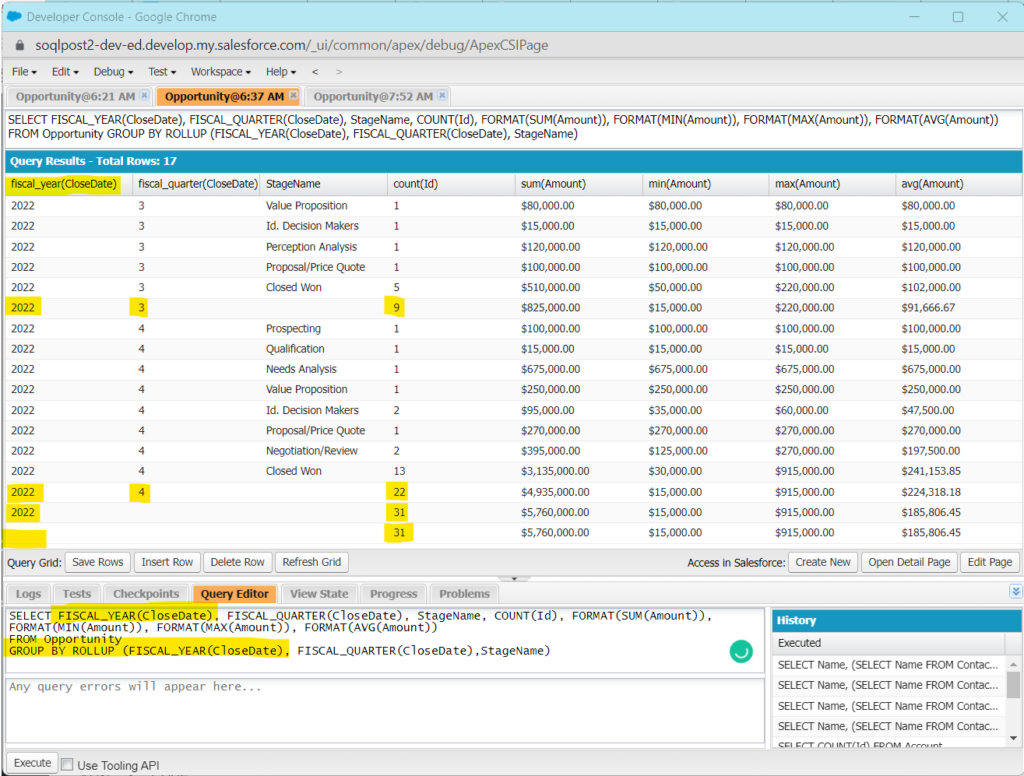
Now we see the year for each quarter. Unfortunately, since our dev org data doesn’t span multiple fiscal years, we’re not able to see this query in all its potential glory. But at least you get the idea.
Own Your Own: Can you think of other ways a GROUP BY or GROUP BY ROLLUP could be used to unlock your org’s data? Take a look at the fields on Account and Opportunity. Look for picklist fields that may help you break down your data into different categories. Once you find one you like, write a query to see what you can extract from the org. Tip: How can you use multiple GROUP BY fields, including date fields, to slice and dice your org’s data?
COUNT_DISTINCT()
It’s now time to take a look at COUNT_DISCTINT(). As I explained earlier, this is a kissing cousin to COUNT(). And like the others, its name reveals its purpose: it only counts distinct (non-repeating) values. It also ignores null values. To see how it works, let’s compare it to COUNT(). First, let’s run the following COUNT on opportunity names:
SELECT COUNT(Name) FROM Opportunity
If you copy and paste the query into the dev console of your dev org, it should return something like this:
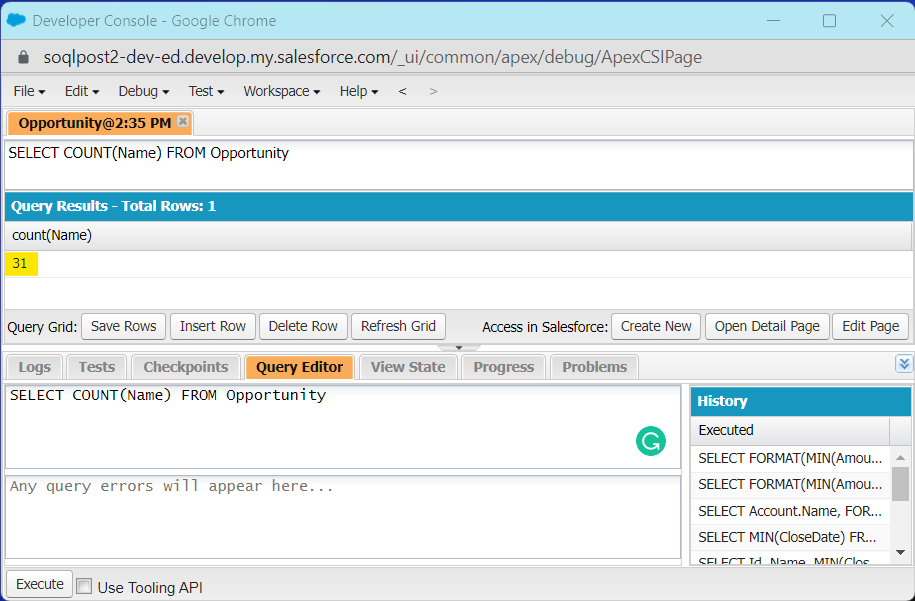
From the screenshot, we can see there are a total of 31 opportunities in our dev org. It’s also important to point out that we’re using COUNT on the Name field, not Id. Now, let’s run the COUNT_DISTINCT() query:
SELECT COUNT_DISTINCT(Name) FROM Opportunity
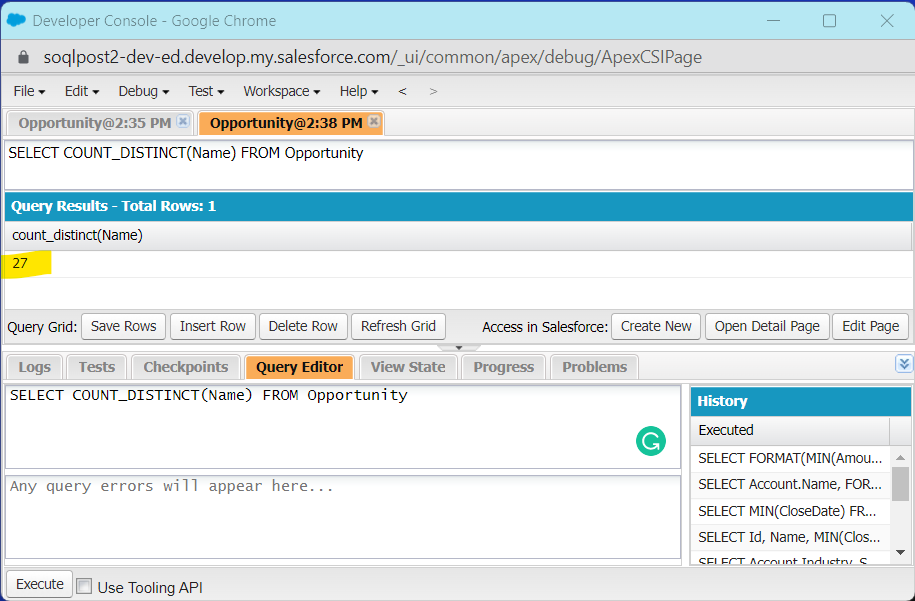
Now it only shows 27 opportunities. What’s going on? Although there are still 31 opportunities, there are 27 distinctly named opportunities. This means there are 4 opportunities with repeating (or duplicate) names.
To find the names that repeat, let’s run the following aggregate query that will only return opportunity names used more than once (aka duplicates):
SELECT Name, COUNT(Id)
FROM Opportunity
GROUP BY Name
HAVING COUNT(Id) > 1
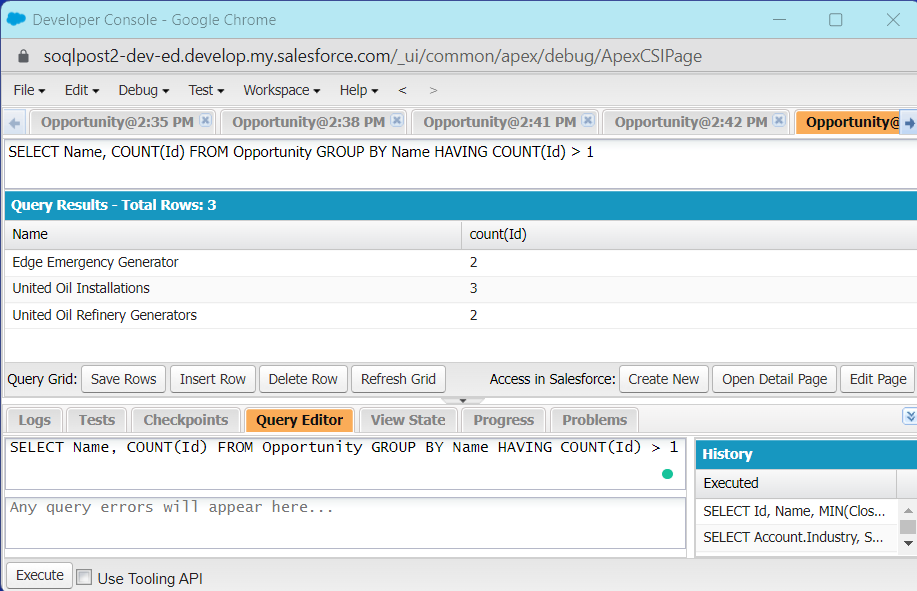
This query informs us that there are 3 opportunity names that are repeated at least once. The first and third names listed are repeated once (which means those names are used twice). And the second name is repeated twice (which means this name is used three times). Now, look through the logic of the query carefully and try to understand it, because now you have a formula for writing queries that identify duplicates.
On Your Own: How would you write a query that identifies duplicate contacts based on name? Test the query by adding a contact with the same exact first and last name as one that already exists. Did it catch the duplicate?
Using Cross Filters
In Report Builder, you can add what Salesforce calls a cross filter. These allow you to include or exclude parent records based on a child object. We can do the same in a SOQL query. In this case, the cross-filter will show up as a subquery in the WHERE clause. But don’t confuse this subquery with those used in the SELECT clause when pulling in child fields (as we covered in Part 2).
To create a cross-filter subquery, you need to make sure that the parent Id field is present on the target object. This means a master-detail (parent-child) or lookup relationship needs to exist between the two.
To better explain, here’s an example. We want to count the number of accounts without opportunities. Because the Opportunity object (the child) has a lookup field to the Account (AccountId), we can use that field in our subquery:
SELECT COUNT(Id)
FROM Account
WHERE Id NOT IN (SELECT AccountId FROM Opportunity)
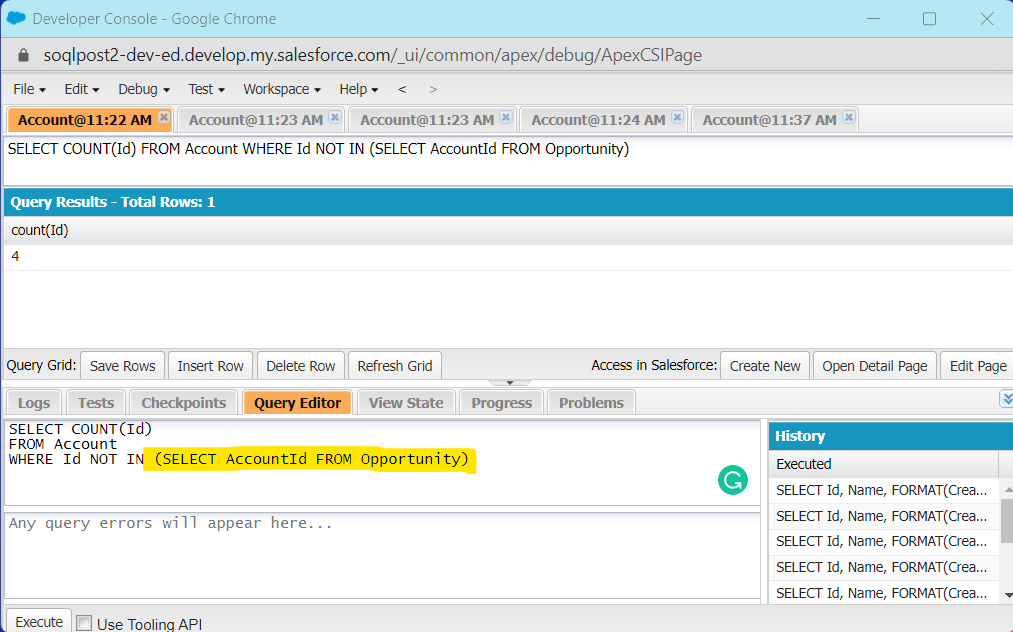
From an earlier query, we know that we have 13 accounts in our dev org. In the screenshot above, we can see that 4 of those accounts have no associated opportunities. To understand what’s happening here, you need to know that Salesforce is running the Opportunity subquery in the WHERE clause first.
As a reminder, our subquery (not the main query) is only returning account Ids associated with opportunities. We’re then asking our main query not to return any accounts found in the subquery’s list. If that doesn’t make sense, run the subquery separately in the dev console. Then imagine Salesforce running all account Ids against that list. If the account Id doesn’t appear in that subquery list, it includes (and counts) the account in our query.
On Your Own: First, write an aggregate query that gives you the number of accounts without contacts. Next, write a SOQL query that returns the names of those same accounts. Need help? Leave a comment below.
Aggregate SOQL Challenges: Test Your Knowledge
Ready to put your knowledge to the test? The following challenges include key concepts learned in Part 3 above, but also knowledge of topics covered in Part 1 and Part 2. No peeking at the answers below until you’ve given them your best effort!
Challenge 1: Write an aggregate SOQL query that breaks down ‘Closed Won’ opportunities by account industry. Include the opportunity record count, as well as the sum, max, min, and average of the amount for each industry. Be sure to format the currency fields.
Challenge 2: Write an aggregate SOQL query that breaks down ‘Closed Won’ opportunities by account owner and month. Include the record count, the total sum, and the average opportunity amount. Also, include the most recent opportunity close date. Include a roll-up summary field. Format all currency and date fields.
Challenge 3: Write an aggregate SOQL query that catches duplicate contacts. It should only identify duplicate records if both the name and email are found in another contact. The query should return the name, email, and number of matches when 2 or more records are found. Be sure it doesn’t return records where the email field is null. Test your query by adding contacts with the same name and email. Test for nulls (blank emails) as well.
Don’t know where to start? I recommend building out each query in small steps. Begin with the base query in the dev console, check if it’s working, and then add on to it (bit by bit) as needed to meet the challenge requirements.
Feeling stuck? Be sure to review Part 1, Part 2, and Part 3 (above) before peeking at the answers below. Use the table of contents in each post to quickly find what you’re looking for (eg, Roll ‘Em Up! GROUP BY ROLLUP).

Challenge 1 Answer
SELECT Account.Industry, COUNT(Id), FORMAT(SUM(Amount)), FORMAT(MIN(Amount)), FORMAT(MAX(Amount)), FORMAT(AVG(Amount))
FROM Opportunity
WHERE StageName = 'Closed Won'
GROUP BY Account.Industry
Challenge 2 Answer
SELECT Owner.Name, CALENDAR_MONTH(CloseDate), Count(Id), FORMAT(SUM(Amount)), FORMAT(AVG(Amount)), FORMAT(MAX(CloseDate))
FROM Opportunity
WHERE StageName = 'Closed Won'
GROUP BY ROLLUP (owner.Name, CALENDAR_MONTH(CloseDate))
Challenge 3 Answer
SELECT Name, Email, Count(Id)
FROM Contact
WHERE Email != null
GROUP BY Name, Email
HAVING Count(Id) > 1
Do you have feedback? I’m always trying to improve this series, so be sure to leave a comment or question below if a concept wasn’t clear. Thanks!
